
Governance and Observability
Codex gives enterprise teams visibility into adoption and impact, plus the auditability needed for security and compliance programs. Use the self-serve dashboard for day-to-day tracking, the Analytics API for programmatic reporting, and the Compliance API to export detailed logs into your governance stack.
Ways to track Codex usage
There are three ways to monitor Codex usage, depending on what you need:
- Analytics Dashboard: quick visibility into adoption, usage, and code review impact.
- Analytics API: pull structured daily metrics into your data warehouse or BI tools.
- Compliance API: exports detailed activity logs for audit, monitoring, and investigations.
Analytics Dashboard
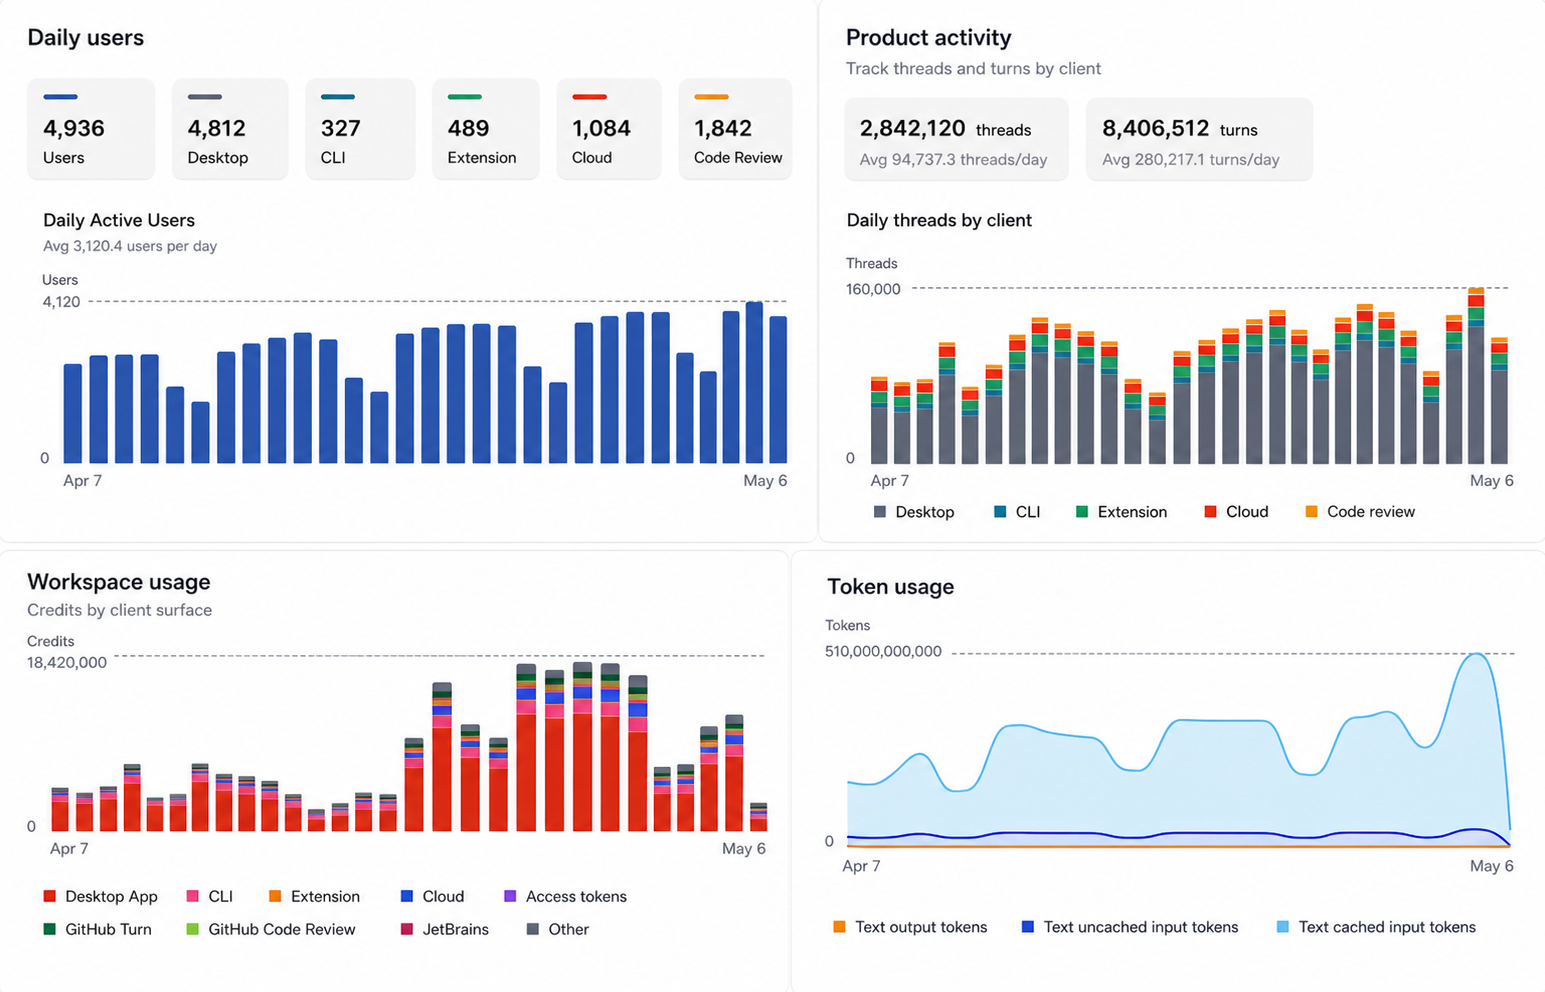
Dashboard views
The analytics dashboard allows ChatGPT workspace administrators and analytics viewers to track Codex adoption, usage, and Code Review feedback. Usage data can lag by up to 12 hours.
Codex provides date-range controls for daily and weekly views. Key charts include:
- Active users by product surface, including CLI, IDE extension, cloud, desktop, and Code Review
- Workspace and personal usage breakdowns, including credit and token usage by product surface or model
- Product activity for threads and turns by client
- User ranking table, with filters for client and sort options such as credits, threads, turns, text tokens, and current streak
- Code Review activity, including PRs reviewed, issues by priority, comments, replies, reactions, and feedback sentiment
- Skill invocations, agent identity usage, and access token usage when your workspace has those features
Data export
Administrators can also export Codex analytics data in CSV or JSON format. Codex provides the following export options:
- Workspace usage, including daily active users, threads, turns, and credits by surface
- Usage per user, including daily threads, turns, and credits across surfaces, with optional email addresses when allowed
- Code Review details, including daily comments, reactions, replies, and priority-level findings
Analytics API
Use the Analytics API when you want to automate reporting, build internal dashboards, or join Codex metrics with your existing engineering data.
What it measures
The enterprise Analytics API returns daily or weekly UTC buckets for a workspace. It supports workspace-level and per-user usage, per-client breakdowns, Code Review throughput, Code Review comment priority, and user engagement with Code Review comments.
Endpoints
The base URL is https://api.chatgpt.com/v1/analytics/codex. All endpoints return paginated page objects with has_more and next_page.
Use start_time for the inclusive Unix timestamp at the beginning of the reporting window, end_time for the exclusive Unix timestamp at the end of the reporting window, group_by for day or week buckets, limit for page size, and page to continue from a previous response. Requests can look back up to 90 days.
Usage
GET /workspaces/{workspace_id}/usage
- Returns totals for threads, turns, credits, and per-client usage in daily or weekly buckets.
- Omit
groupto return per-user rows. - Set
group=workspaceto return workspace-wide rows. - Includes text input, cached input, and output token fields.
Code review activity
GET /workspaces/{workspace_id}/code_reviews
- Returns pull request reviews completed by Codex.
- Returns total comments generated by Codex.
- Breaks comments down by P0, P1, and P2 priority.
User engagement with code review
GET /workspaces/{workspace_id}/code_review_responses
- Returns replies and reactions to Codex comments.
- Breaks reactions down into positive, negative, and other reactions.
- Counts comments that received reactions, replies, or either form of engagement.
How it works
Analytics uses time windows and supports day or week grouping. Results are time-ordered and returned in pages with cursor-based pagination. Use an API key scoped to codex.enterprise.analytics.read.
Common use cases
- Engineering observability dashboards
- Adoption reporting for leadership updates
- Usage governance and cost monitoring
Compliance API
Use the Compliance API when you need auditable records for security, legal, and governance workflows.
What it measures
The Compliance API gives enterprises a way to export logs and metadata for Codex activity so you can connect that data to your existing audit, monitoring, and security workflows. It is designed for use with tools like eDiscovery, DLP, SIEM, or other compliance systems.
For Codex usage authenticated through ChatGPT, Compliance API exports provide audit records for Codex activity and can be used in investigations and compliance workflows. These audit logs are retained for up to 30 days. API-key-authenticated Codex usage follows your API organization settings and is not included in Compliance API exports.
What you can export
Activity logs
- Prompt text sent to Codex
- Responses Codex generated
- Identifiers such as workspace, user, timestamp, and model
- Token usage and related request metadata
Metadata for audit and investigation
Use record metadata to answer questions like:
- Who ran a task
- Who created or revoked an access token
- When it ran
- Which model was used
- How much content was processed
Common use cases
- Security investigations
- Compliance reporting
- Policy enforcement audits
- Routing events into SIEM and eDiscovery pipelines
What it does not provide
- Lines of code generated (a bit of a noisy proxy for productivity and can incentivize the wrong behavior)
- Acceptance rate of suggestions (almost 100% since users usually accept the change first)
- Code quality or performance KPIs
Recommended pattern
Most enterprises use a combination of:
- Analytics Dashboard for self-serve monitoring and quick answers
- Analytics API for automated reporting and BI integration
- Compliance API for audit exports and investigations