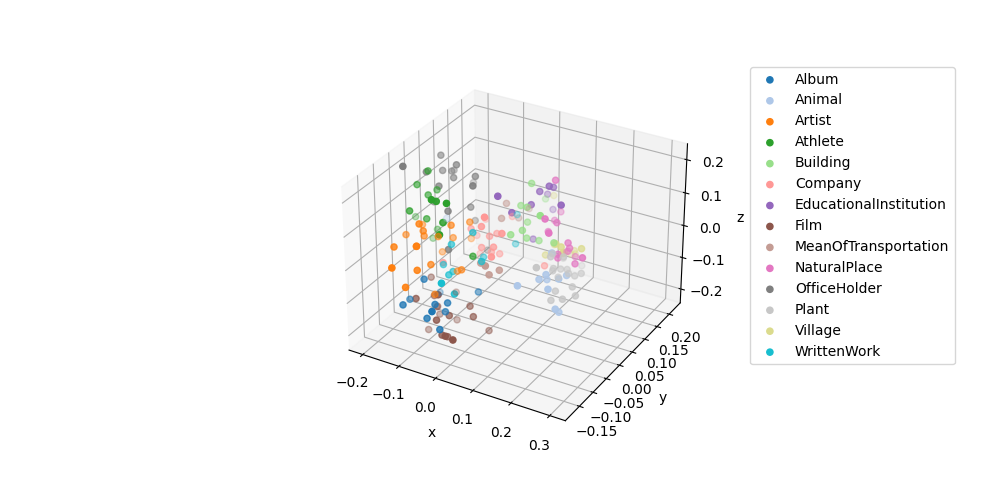
The example uses PCA to reduce the dimensionality fo the embeddings from 1536 to 3. Then we can visualize the data points in a 3D plot. The small dataset dbpedia_samples.jsonl is curated by randomly sampling 200 samples from DBpedia validation dataset.
1. Load the dataset and query embeddings
import pandas as pd
samples = pd.read_json("data/dbpedia_samples.jsonl", lines=True)
categories = sorted(samples["category"].unique())
print("Categories of DBpedia samples:", samples["category"].value_counts())
samples.head()
Categories of DBpedia samples: Artist 21
Film 19
Plant 19
OfficeHolder 18
Company 17
NaturalPlace 16
Athlete 16
Village 12
WrittenWork 11
Building 11
Album 11
Animal 11
EducationalInstitution 10
MeanOfTransportation 8
Name: category, dtype: int64| text | category | |
|---|---|---|
| 0 | Morada Limited is a textile company based in ... | Company |
| 1 | The Armenian Mirror-Spectator is a newspaper ... | WrittenWork |
| 2 | Mt. Kinka (金華山 Kinka-zan) also known as Kinka... | NaturalPlace |
| 3 | Planning the Play of a Bridge Hand is a book ... | WrittenWork |
| 4 | Wang Yuanping (born 8 December 1976) is a ret... | Athlete |
from utils.embeddings_utils import get_embeddings
# NOTE: The following code will send a query of batch size 200 to /embeddings
matrix = get_embeddings(samples["text"].to_list(), model="text-embedding-3-small")
2. Reduce the embedding dimensionality
from sklearn.decomposition import PCA
pca = PCA(n_components=3)
vis_dims = pca.fit_transform(matrix)
samples["embed_vis"] = vis_dims.tolist()
3. Plot the embeddings of lower dimensionality
%matplotlib widget
import matplotlib.pyplot as plt
import numpy as np

fig = plt.figure(figsize=(10, 5))
ax = fig.add_subplot(projection='3d')
cmap = plt.get_cmap("tab20")

# Plot each sample category individually such that we can set label name.
for i, cat in enumerate(categories):
    sub_matrix = np.array(samples[samples["category"] == cat]["embed_vis"].to_list())
    x=sub_matrix[:, 0]
    y=sub_matrix[:, 1]
    z=sub_matrix[:, 2]
    colors = [cmap(i/len(categories))] * len(sub_matrix)
    ax.scatter(x, y, zs=z, zdir='z', c=colors, label=cat)

ax.set_xlabel('x')
ax.set_ylabel('y')
ax.set_zlabel('z')
ax.legend(bbox_to_anchor=(1.1, 1))
<matplotlib.legend.Legend at 0x1622180a0>