
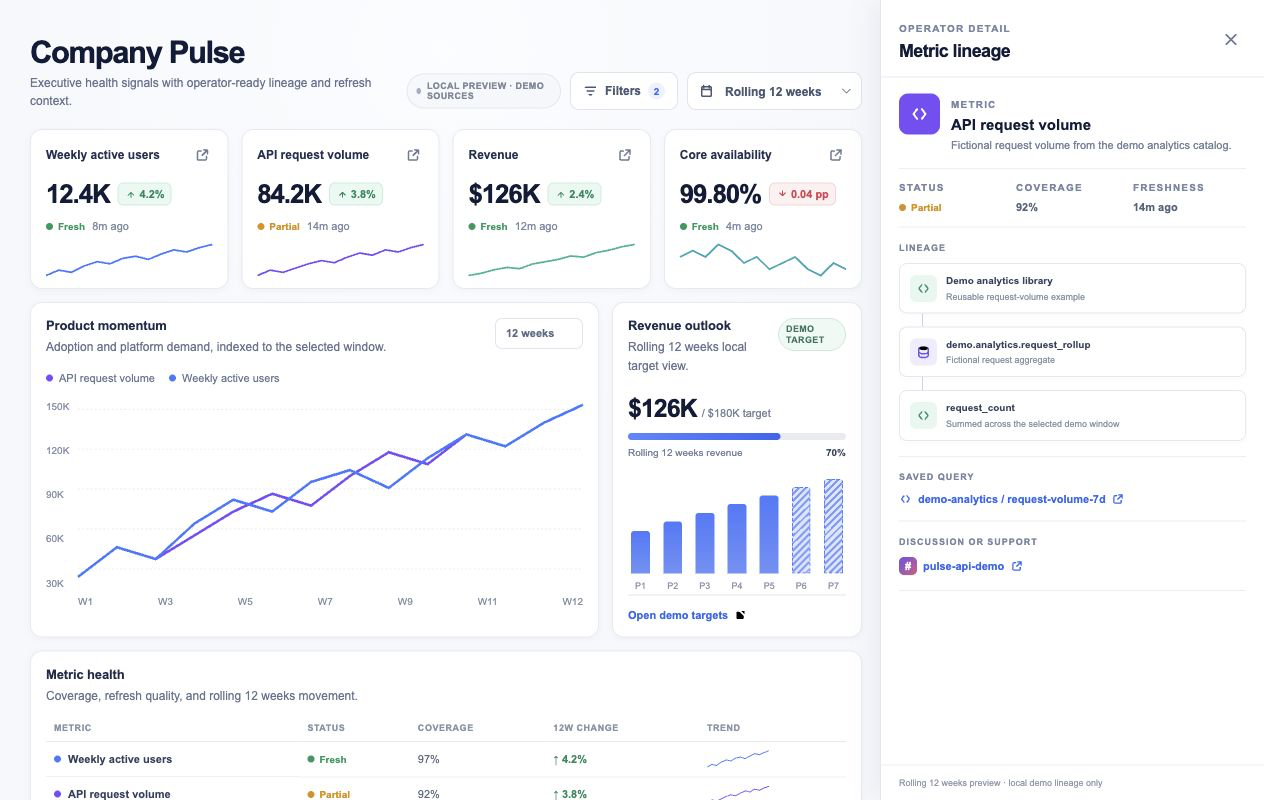
Pulse Dashboard
Author: OpenAI
An executive KPI dashboard with trends, targets, metric health, and lineage details.
Description
An executive dashboard with KPI cards, momentum trends, revenue targets, a metric health table, and an operator-ready lineage drawer.
Prompt
@Sites Build an internal company Pulse Dashboard.

Use @kepler as the primary metrics and warehouse query tool, @slack for metric discussions, and @spreadsheets for manually maintained targets.

Create a clean, executive-readable KPI dashboard using metrics relevant to the company and informed by active Slack discussions. Keep the interface modern, airy, and restrained, with subtle accent colors.

## Main Layout

Do not add a top navigation bar. Start directly with the dashboard title and a short descriptive subtitle.

Place a compact Filters control and a functional timing-window dropdown near the title. Support rolling 4-week, 12-week, 26-week, and 52-week views. Changing the timing window must update KPI values, deltas, charts, targets, and table labels.

Do not add a fake refresh button, dead links, warning banners, Data operations cards, or Recent annotations cards.

## KPI Cards

Show the main KPIs in a prominent card grid. Each KPI card must display:

- Current value
- Delta for the selected timing window
- Freshness
- Compact trend visualization
- Status such as fresh, partial, stale, or permission denied

Make every dashboard card clickable, not only the top KPI cards. Clicking a card should open the most relevant metric lineage detail.

Use a subtle neutral badge for cached-preview or partial-source states. Avoid prominent yellow warning treatments.

## Charts And Targets

Include:

- A product or business momentum chart that updates with the selected timing window
- A target-attainment card sourced from the maintained spreadsheet
- A full-width Metric health table

The Metric health table should show:

- Metric
- Status
- Coverage
- Selected-window change
- Trend

## Metric Lineage Drawer

Add a metric lineage drawer for operator debugging. It should show:

- Selected metric name and description
- Status, coverage, and freshness
- Source tables, fields, and saved queries from Kepler
- A link to the underlying saved query
- A Discussion or support section with a relevant Slack channel

Use real Slack channels when available. Otherwise, hide this section.

Do not include a generic Query states legend in the drawer.

## Data And Caching

Use D1 to persist:

- Dashboard configurations
- Saved filters
- Metric annotations for future operator workflows
- A separate cached metric snapshot for each supported timing window

Seed only missing timing-window caches. Do not overwrite a previously refreshed cached snapshot when the dashboard loads.

Show loading, stale, partial-data, and permission-denied states contextually on metrics and inside the lineage drawer, without adding a large warning banner.

## Quality Bar

Keep the primary view calm and executive-focused. Operator detail should be available through clickable cards and the lineage drawer instead of cluttering the main dashboard.
Related projects
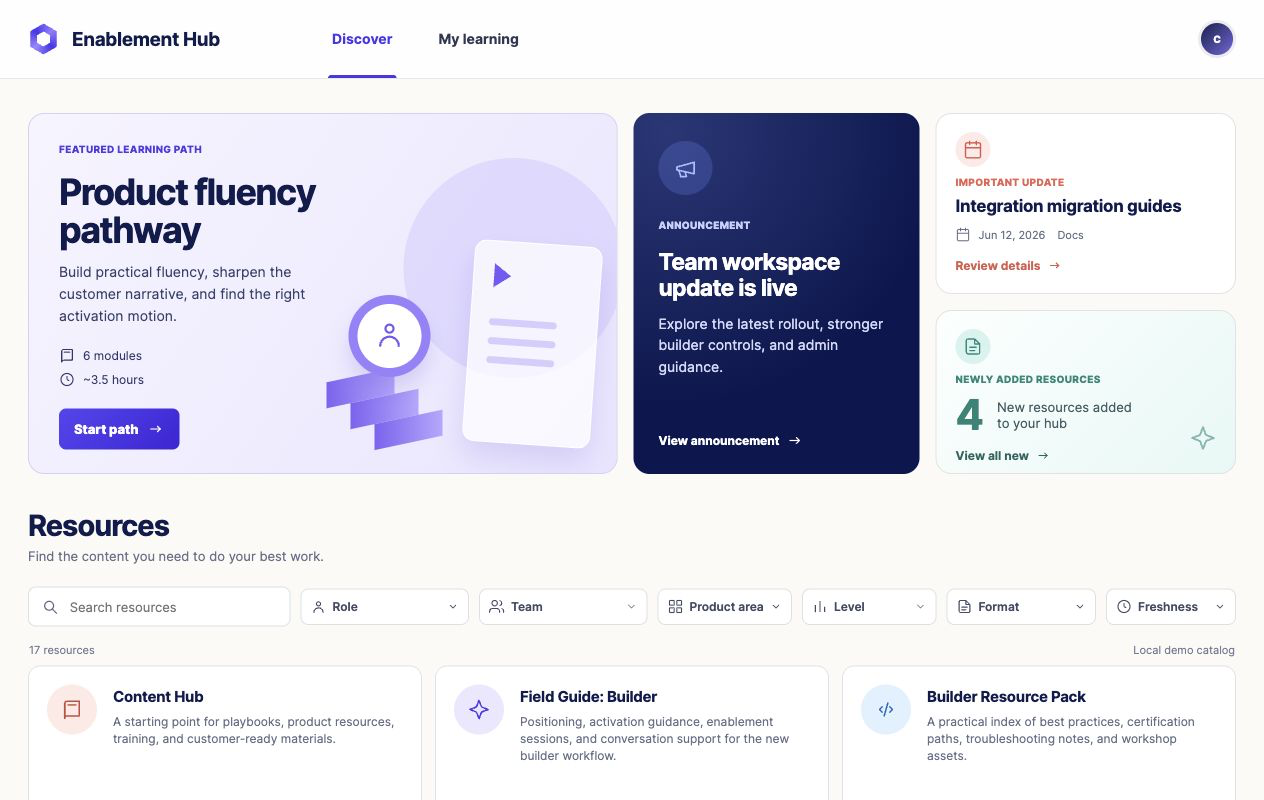
Enablement Hub
An internal learning hub with featured training, announcements, and a...
GPT-5.5 Vinext
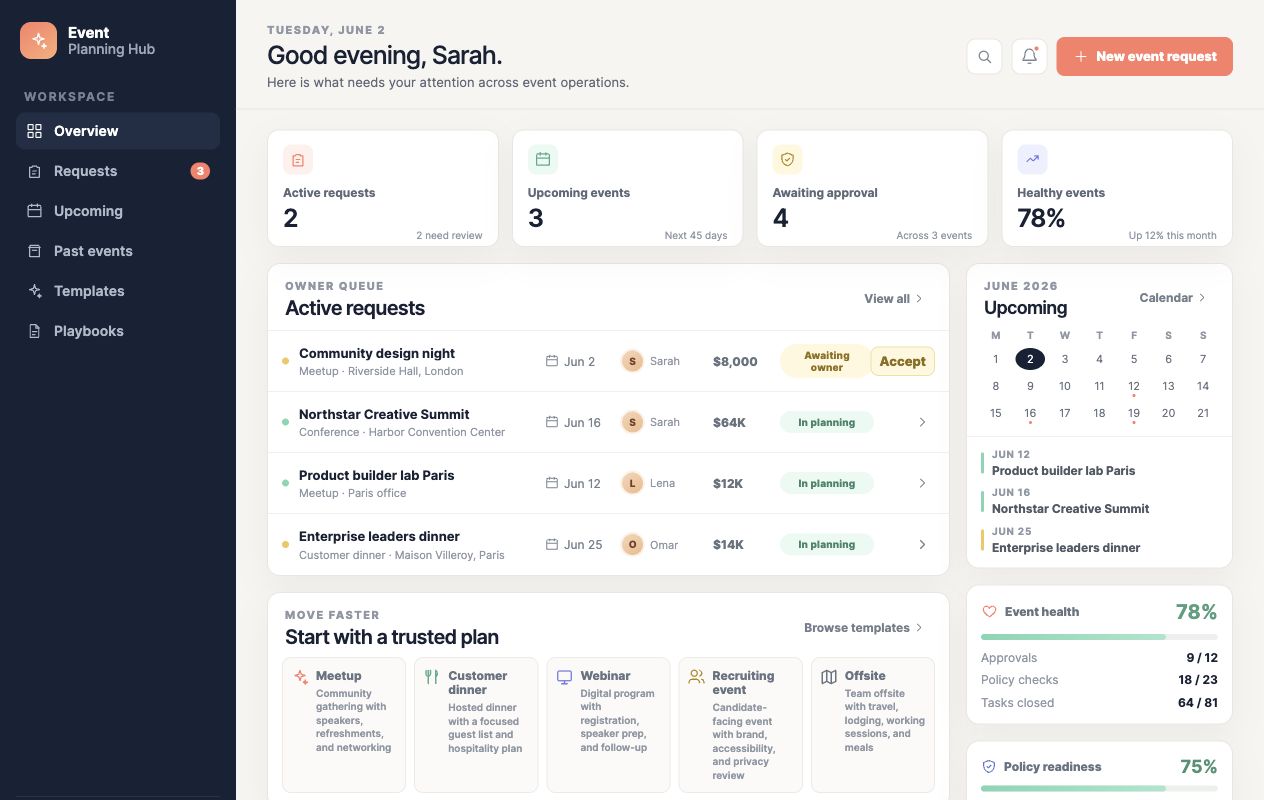
Event Planning Hub
An event planning dashboard with active request triage, event templates...
GPT-5.5 Vinext
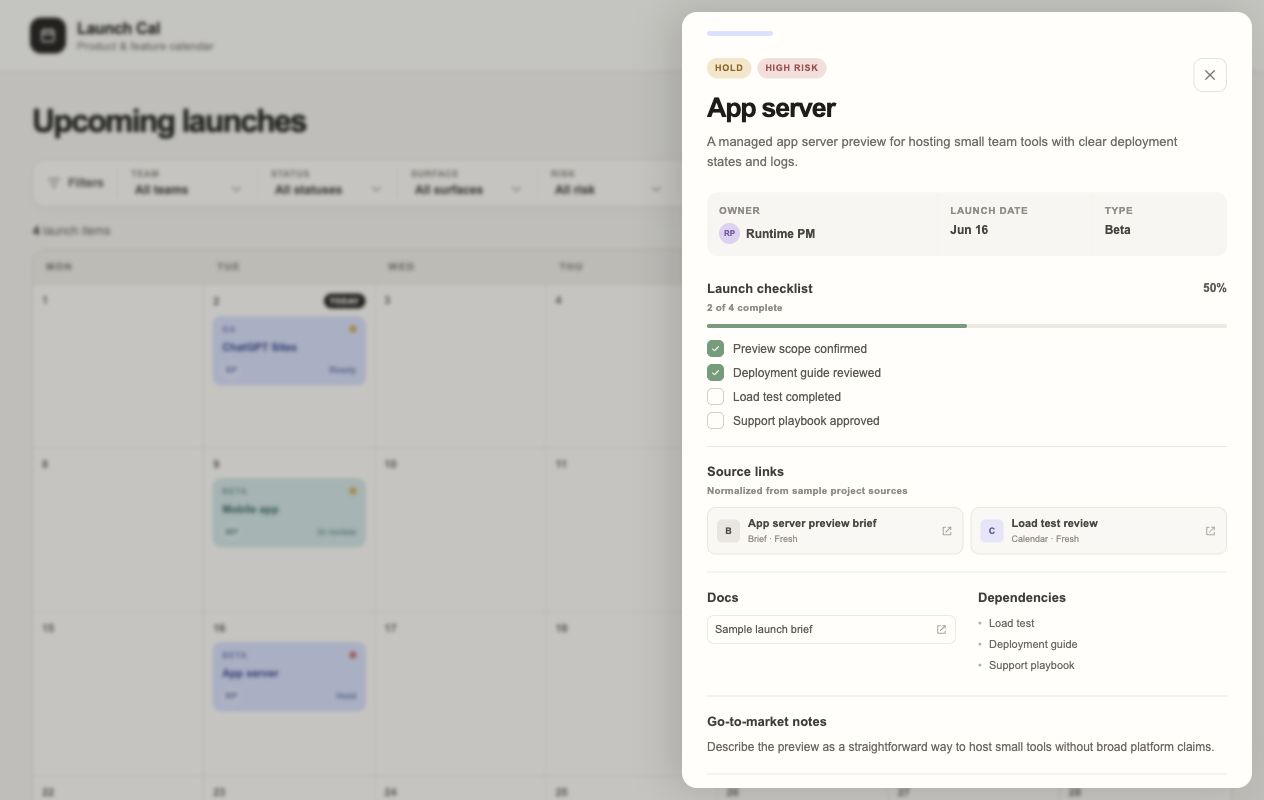
Launch Cal
A monthly product and feature calendar with team, status, surface, risk...
GPT-5.5 Vinext